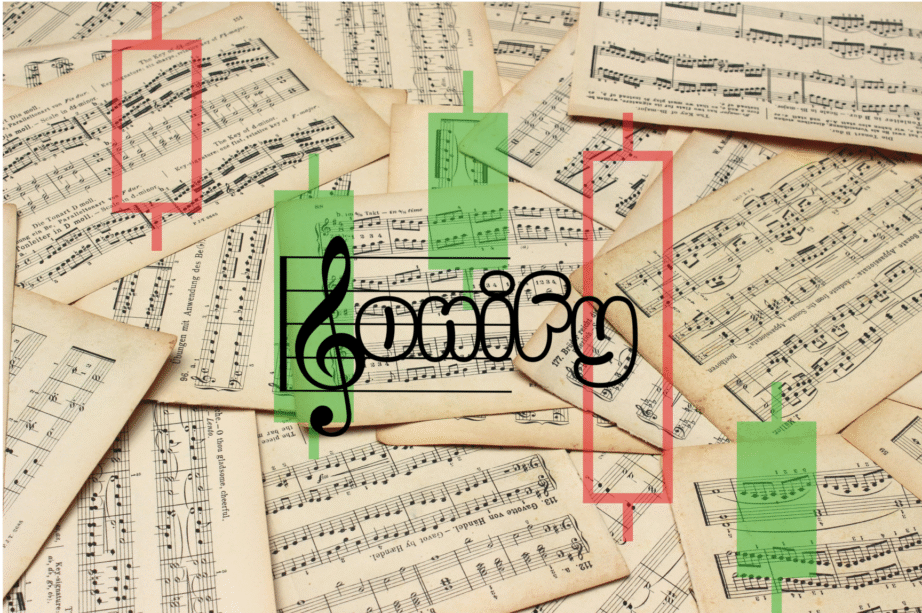
Understanding Market Sonification
Market sonification is the innovative process of converting financial data into audible formats, allowing traders and analysts to interpret market movements through sound. By attributing sonic qualities to price levels, volatility, and trading patterns, individuals can gain new insights not just visually but auditorily. This exploration will focus on mapping price levels, utilizing tempo and rhythm, and the powerful implications of sonifying financial data.
Mapping Price Levels to Musical Notes
One of the fundamental ways to engage with market sonification is by mapping price levels or momentum to musical notes. For instance, high price levels could correspond to higher pitches, while lower levels may translate to deeper sounds. This correlation allows traders to intuitively grasp the significance of various price points.
Octave Scaling
Utilizing octave scaling is an effective method to express price variations. Each octave can represent a specific range of price levels, making it easier to understand market dynamics. As prices fluctuate, the sounds shift, giving traders an audio cue about market behaviour. For example:
- Octave 1: Prices below support level.
- Octave 2: Prices at support and approaching resistance.
- Octave 3: Prices breaking through resistance.
Expressing Volatility Through Tempo and Rhythm
Volatility is a key characteristic of financial markets that can also be captured audibly. By translating volatility into tempo or rhythm, traders can be alerted to sudden market changes.
Creating Rhythmic Patterns
Using rhythmic patterns to express market volatility brings a unique dimension to trading strategies. For instance:
- Increased Volatility: A faster tempo may indicate rapid price movements or market instability.
- Stable Market: A slower tempo could suggest a calmer market environment.
This rhythmic interpretation can help traders identify potential breakouts or reversals. For example, if the tempo quickens unexpectedly, it could serve as a warning to examine the market closely.
Translating OHLC Data into MIDI
Open, High, Low, and Close (OHLC) data can be translated into digital audio formats such as MIDI. MIDI conversion allows traders to represent complex market data through a series of musical notes and rhythms.
Leveraging MIDI for Dynamic Analysis
By converting trade data into MIDI, traders can represent various aspects of the market as a musical composition. For example:
- Open Prices: Correspond to the initial notes in a melody.
- High Prices: Represent sharp, rising notes.
- Low Prices: Correspond to deeper, resonant sounds.
- Close Prices: Signal the conclusion of the melody.
This method not only provides auditory feedback but also creates a dynamic representation of market behaviour. It can be particularly effective when used alongside visualization techniques to enhance comprehension.
Algorithmic Composition from Market Data
Real-world examples of algorithmic composition from market data illustrate the practical application of sonification. Many trading platforms now integrate sounds to signify specific trading alerts.
Breakout Sounds
One compelling use case is the auditing of breakout levels using distinct sounds. When a price breaks through a significant resistance level, a specific harmonic chord can play. This allows traders to focus on their screens without needing to constantly monitor price movements.
Sound Alerts for Technical Levels
Additionally, traders can set up sound alerts for when price levels approach their identified support or resistance points. These alerts can be as simple or complex as necessary, making it easier for traders to act promptly.
Educational and Accessibility Benefits
Sonifying financial data also offers numerous educational and accessibility benefits. Audio can provide an alternative means of engagement for individuals who may struggle with visual data representation.
Mental Mapping with Sound
By creating a ‘sound map’ of market movements, individuals can train their auditory senses to recognize patterns related to trading. This helps analysts develop a better understanding of price structures and trader psychology.
Engaging New Audiences
Newcomers to the trading world can find it easier to grasp concepts through sound. By melding finance with art, market sonification captures the interests of creatives who might not otherwise engage with traditional financial analysis.
Conclusion
Market sonification opens up a new frontier for traders, analysts, and creatives alike. Through the process of translating market data into sound, individuals gain new perspectives on trend analysis and price movement. The integration of harmonic chords that define support and resistance levels creates a rich, engaging experience that enhances understanding through auditory interpretation.
As we continue exploring these innovative techniques, the potential for deeper insights and broader engagement with financial markets will undoubtedly grow.
For further information on market sonification techniques and their implications in trading, consider exploring these resources: Investopedia on Sonification, MIT Media Lab, and IEEE Xplore.