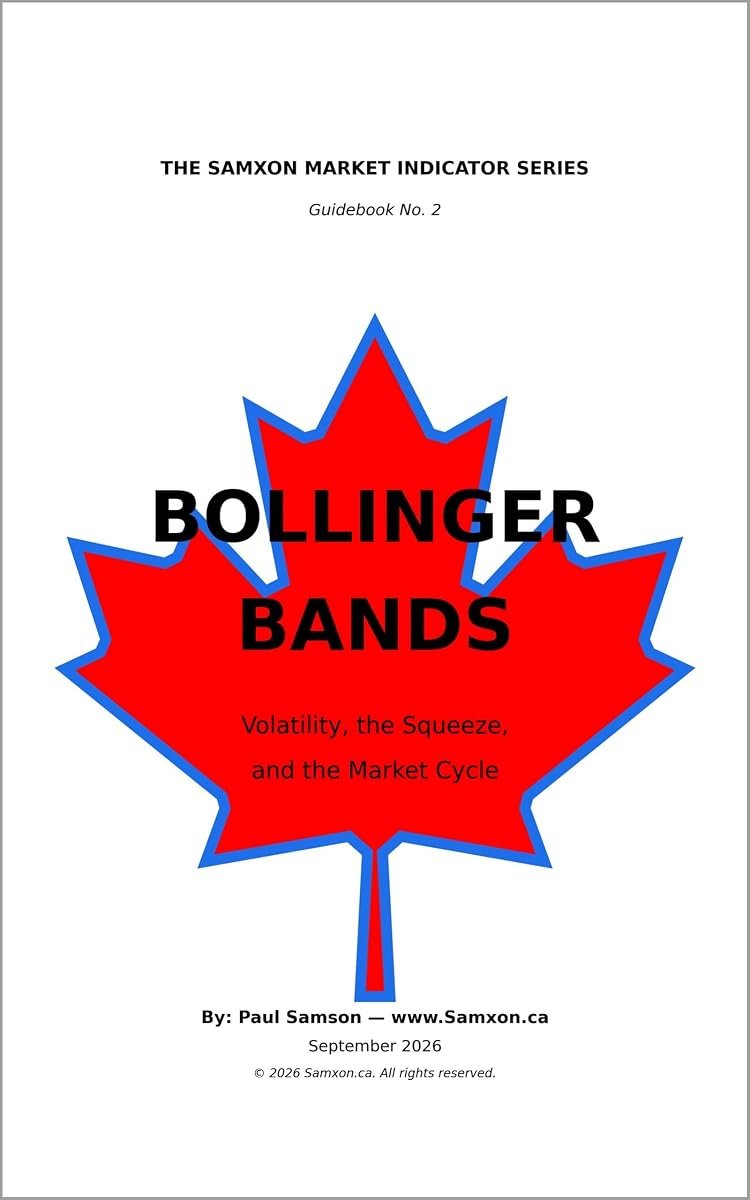
Guidebook No. 2 of The Samxon Market Indicator Series by Paul Samson. Many traders treat a touch of the upper or lower band as a signal to sell or buy, and that approach fails. This guidebook presents Bollinger Bands for what they really are: a volatility map that shows what counts as a normal price right now, and whether that range is expanding or contracting.
What you will learn in the Bollinger Bands guidebook
- How the bands, %B and BandWidth are calculated
- How to choose and adjust the settings
- Five core setups: the Squeeze, walking the bands, mean reversion in a range, W-bottoms and M-tops, and the middle band cross
- Reading the bands through a full market cycle, with the price cycle and volatility cycle running together
- A bar-by-bar worked example
The central idea: Squeezes tend to form near cycle turning points, and losing the upper band while price still pushes higher marks the top.
Get your copy of Bollinger Bands: $9.99 USD
Instant digital download. Choose the store you prefer; the price is the same everywhere.
- Series: The Samxon Market Indicator Series, No. 2
- Author: Paul Samson, Samxon.ca
- Format: Digital guidebook with charts and worked examples
- Price: $9.99 USD
Earn 25% by sharing this guidebook
Have an audience of traders or investors? Join our affiliate program and earn a 25% commission on every sale you refer. See how to become a Samxon affiliate.
Related guidebooks in the series
For educational purposes only; not financial advice.